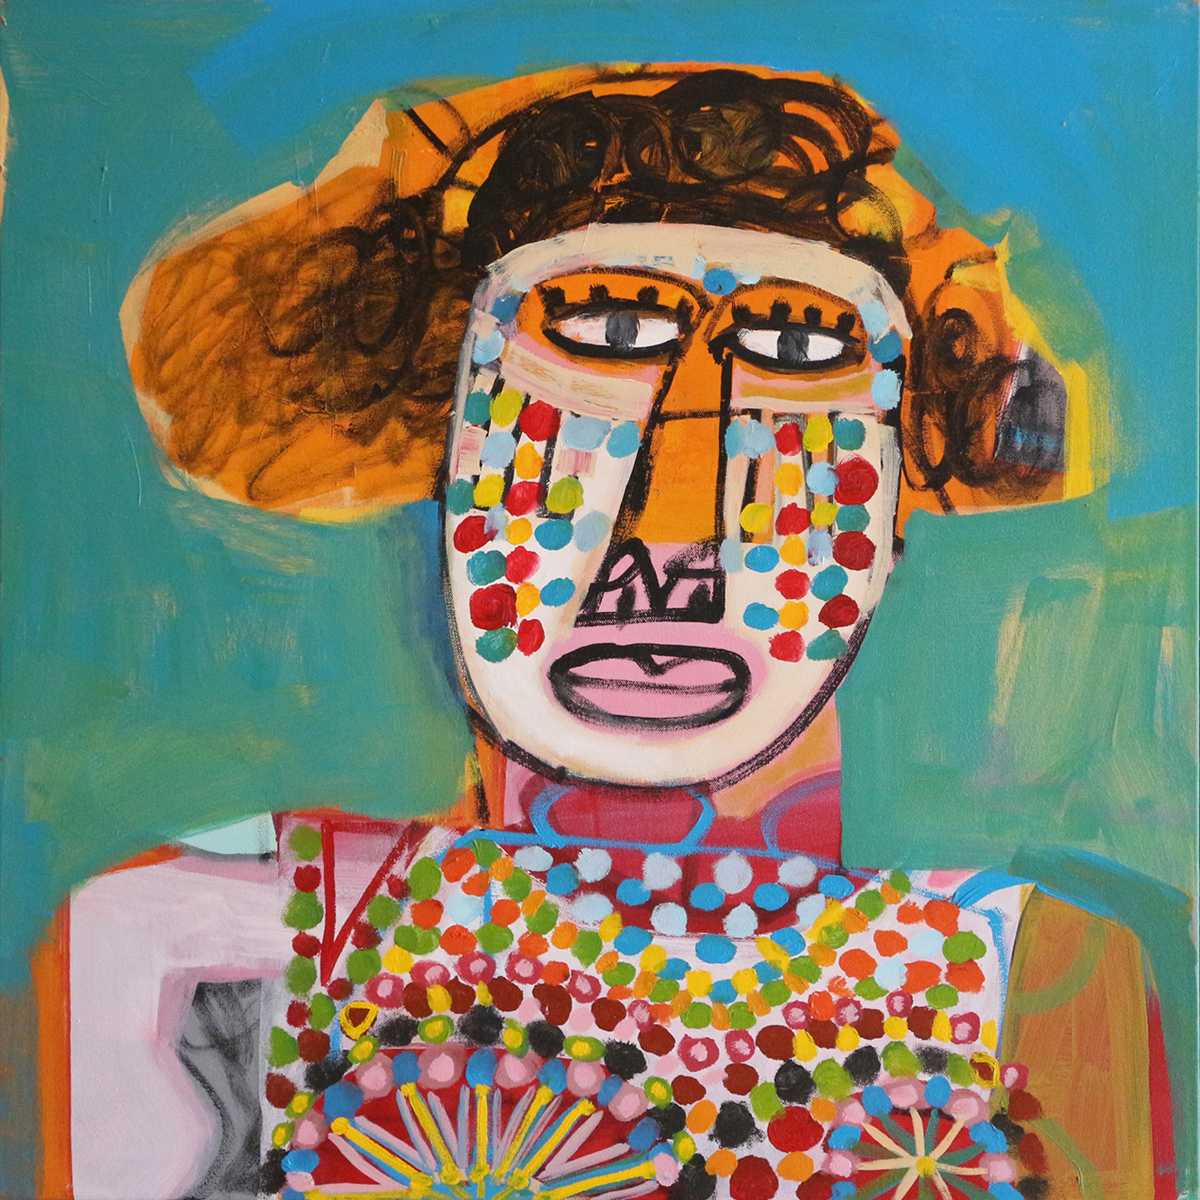
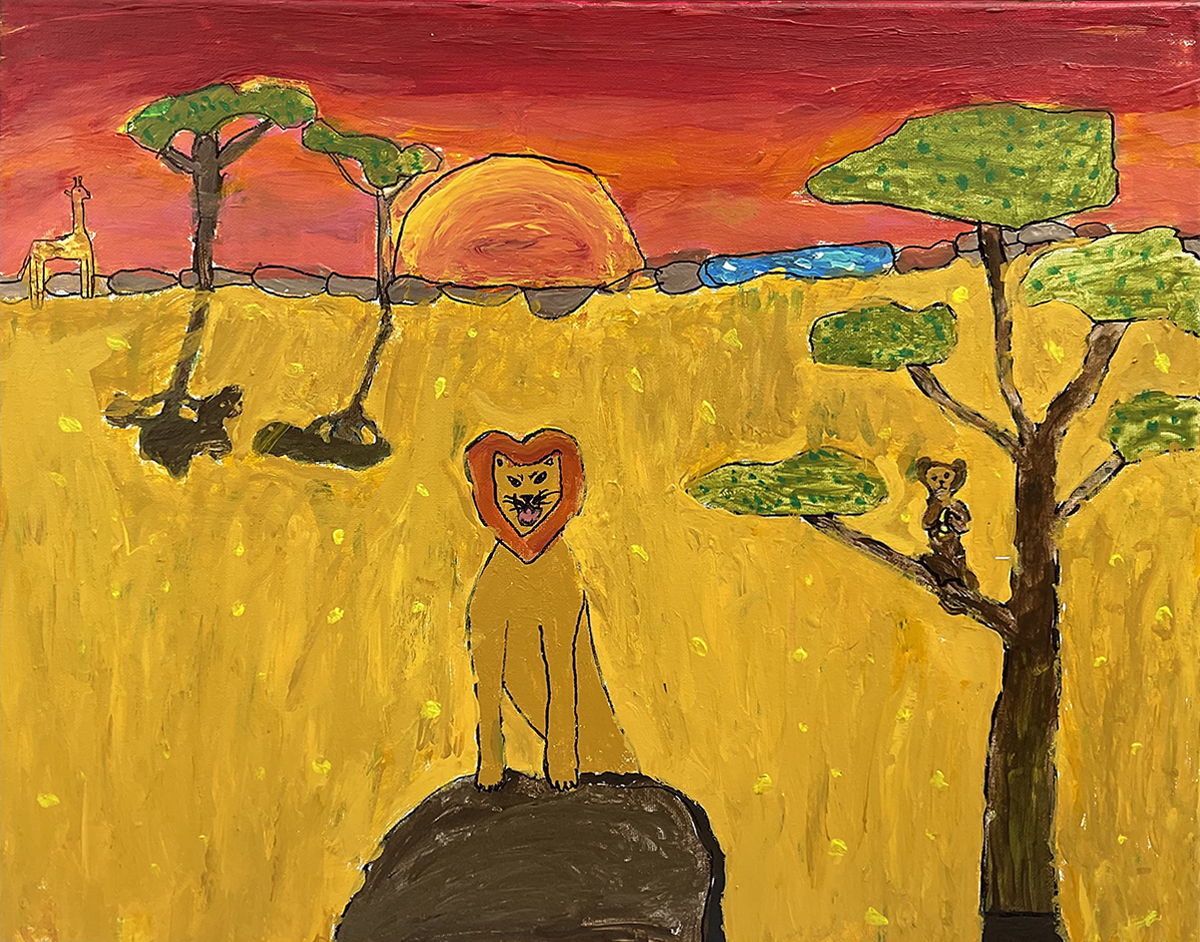
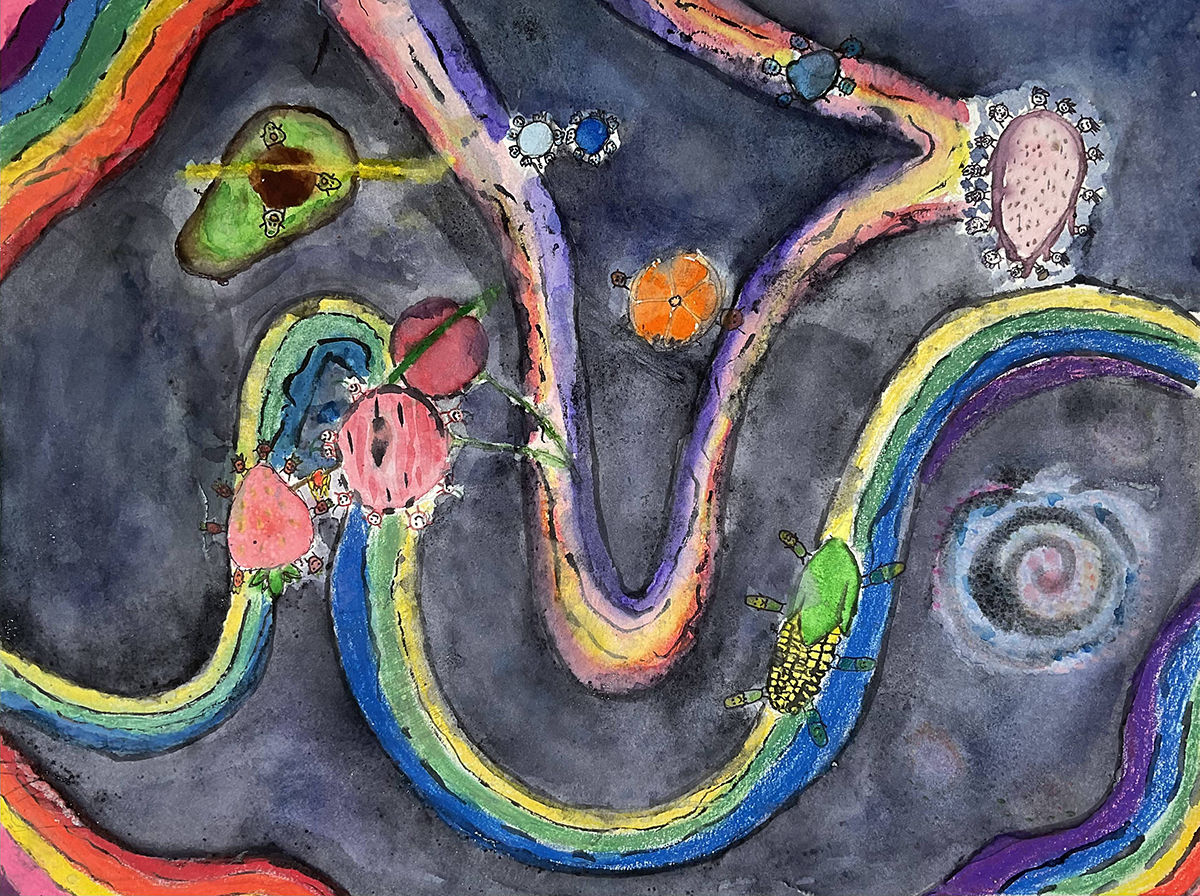
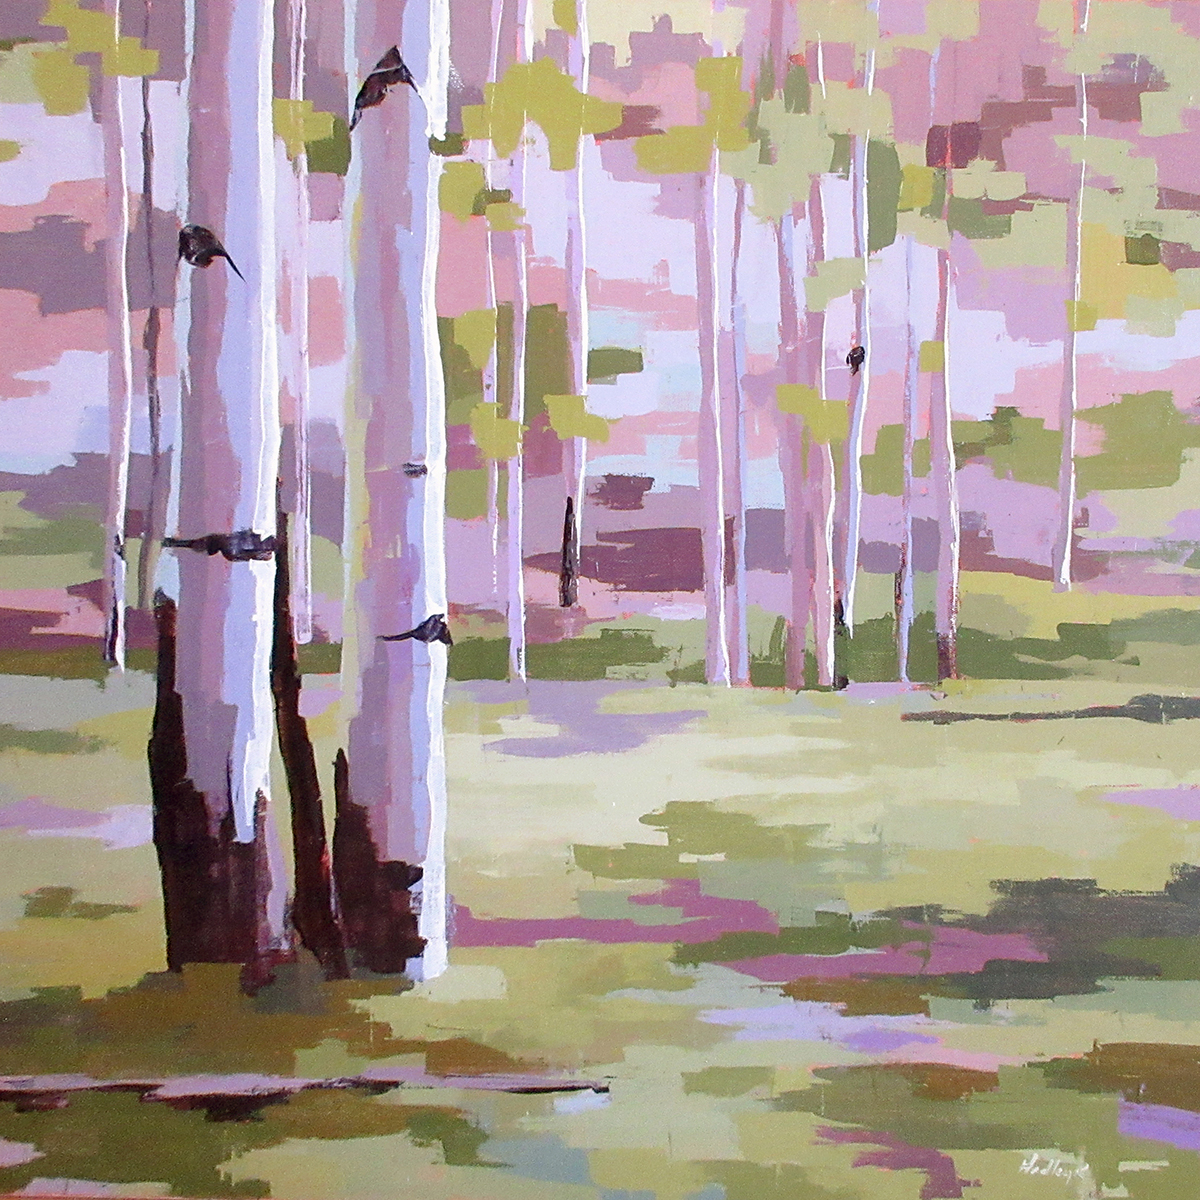
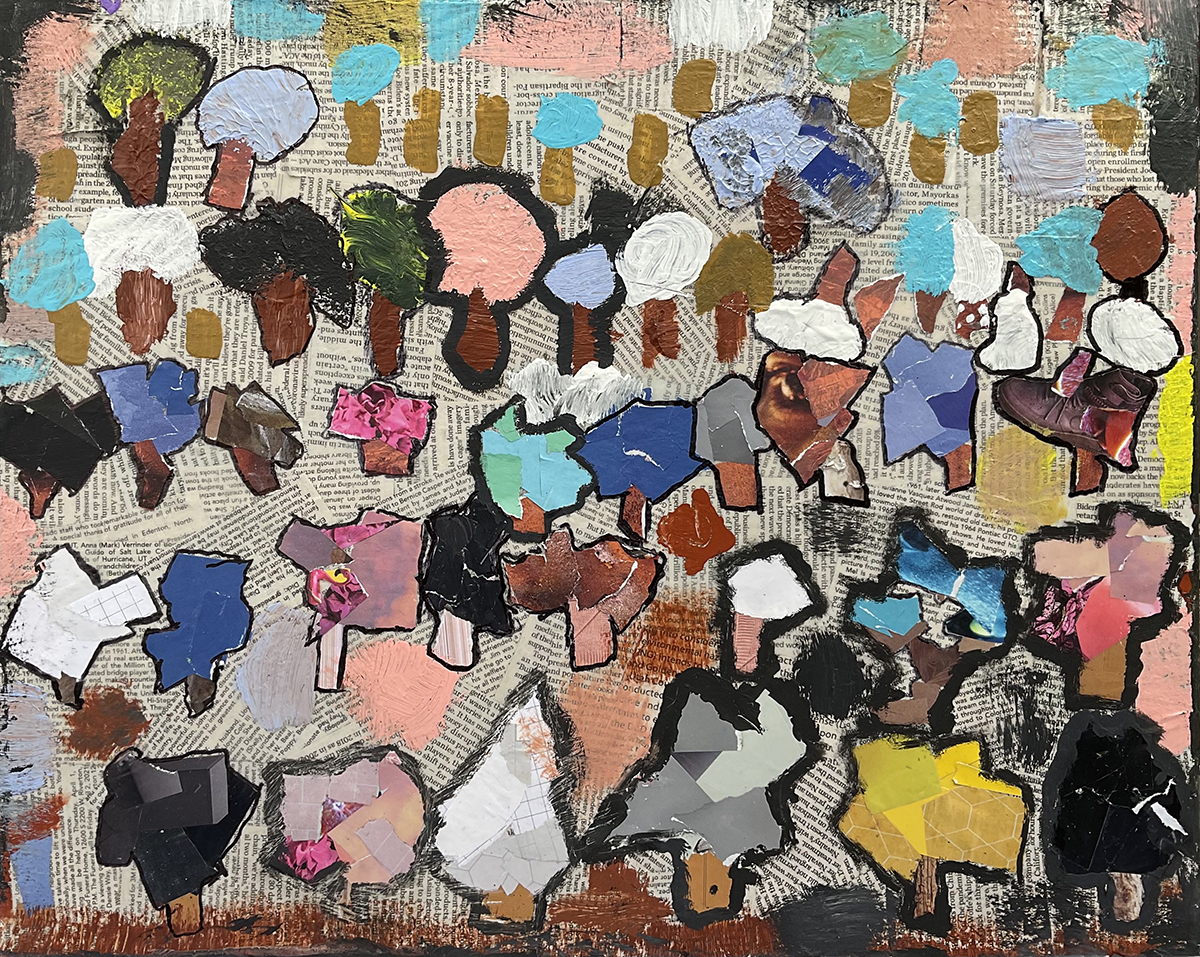
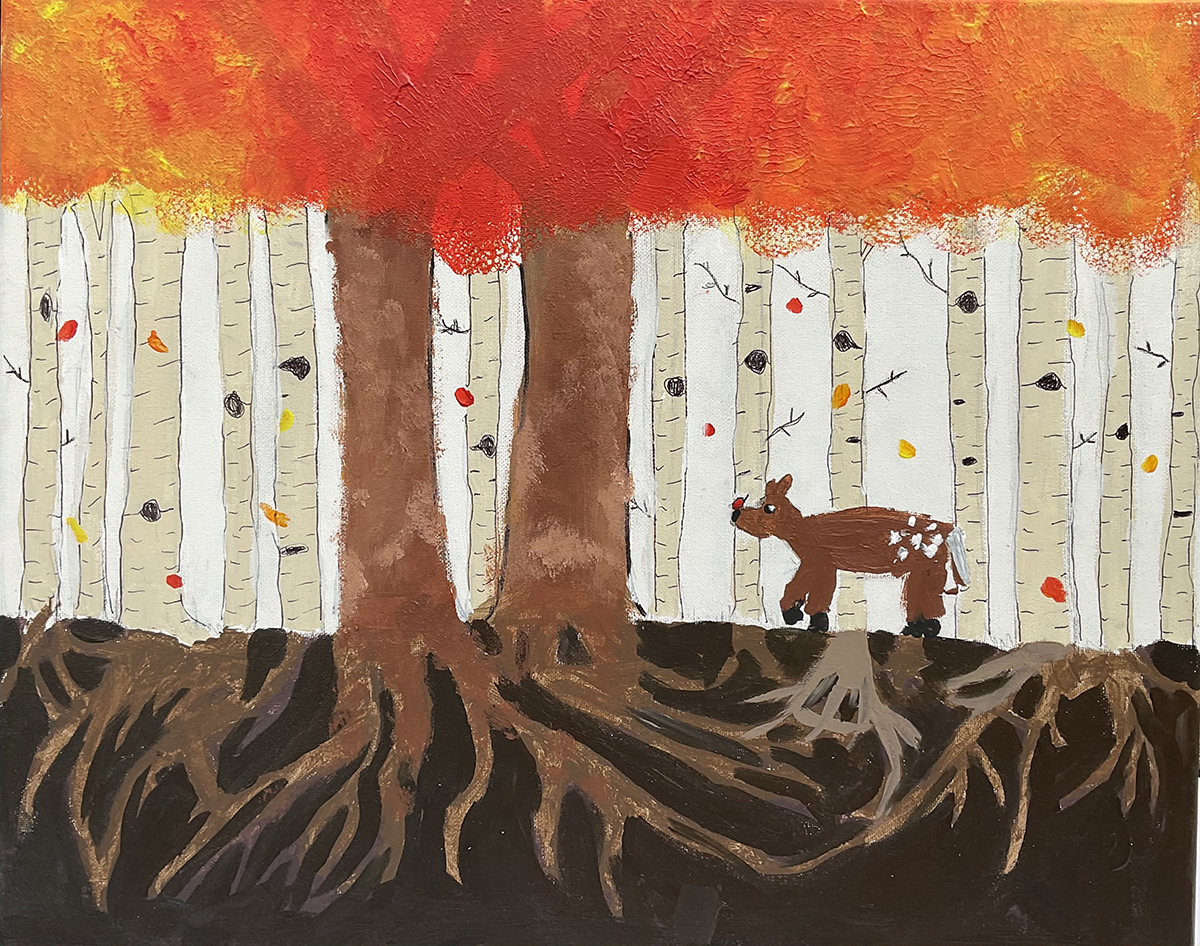
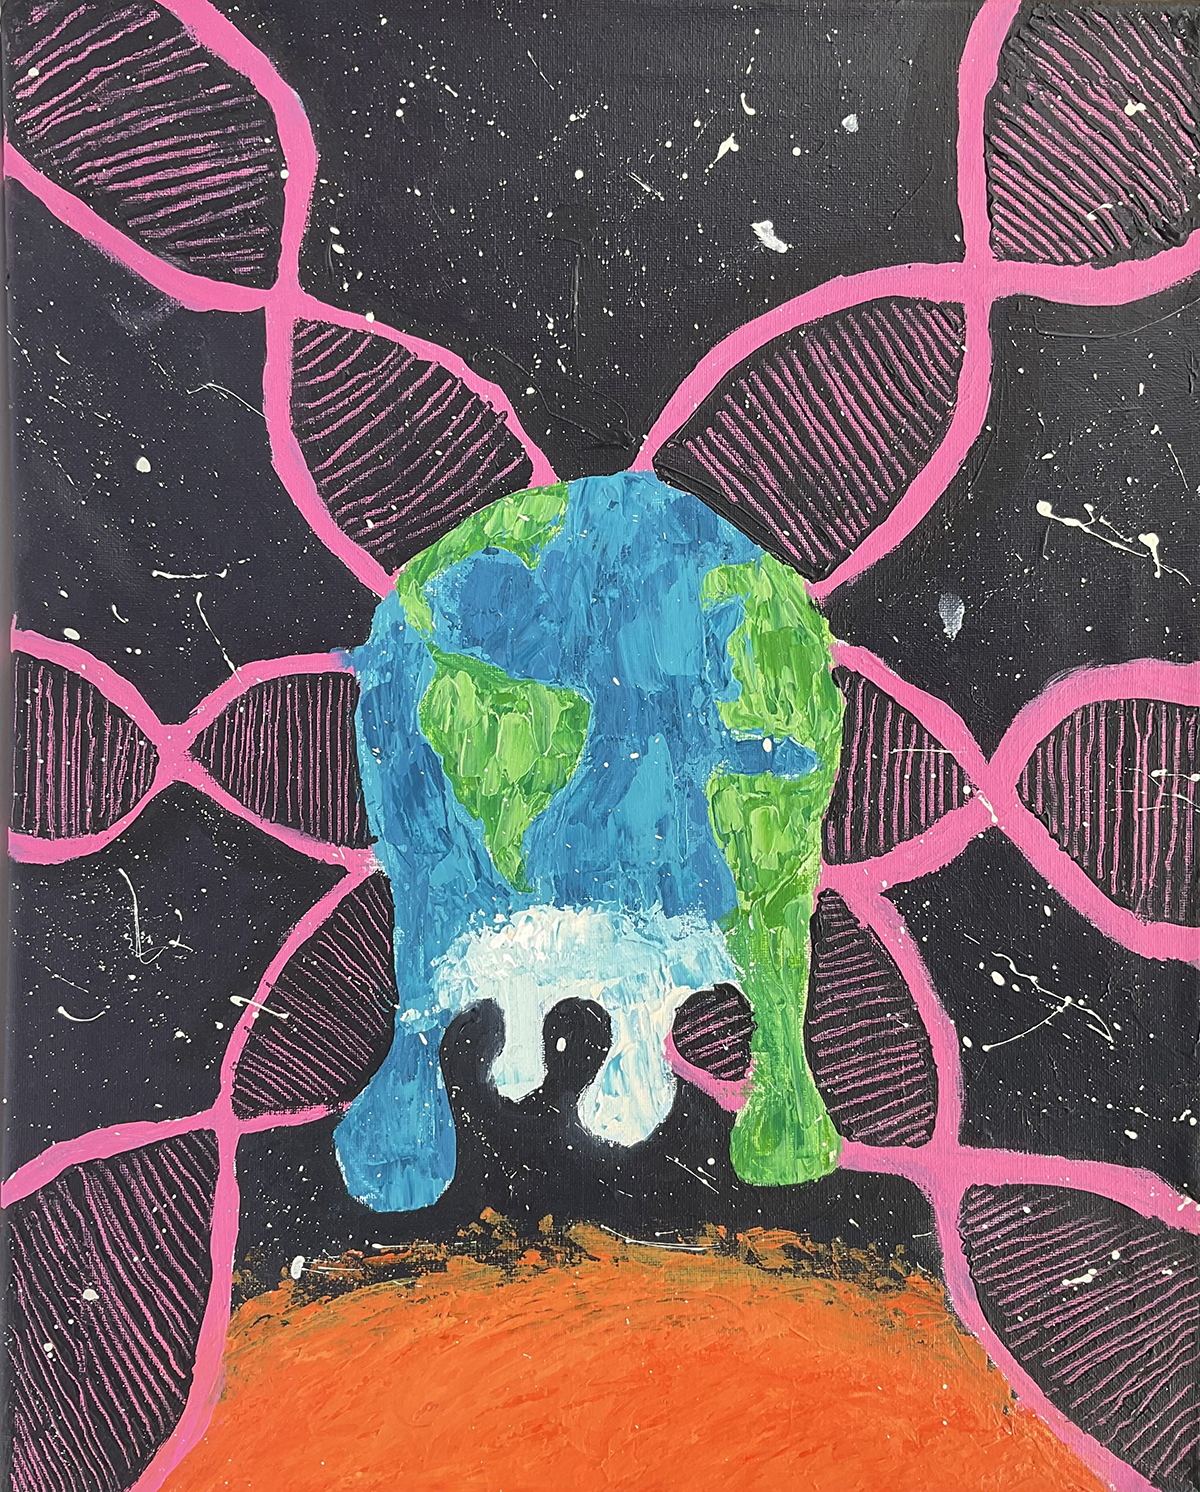
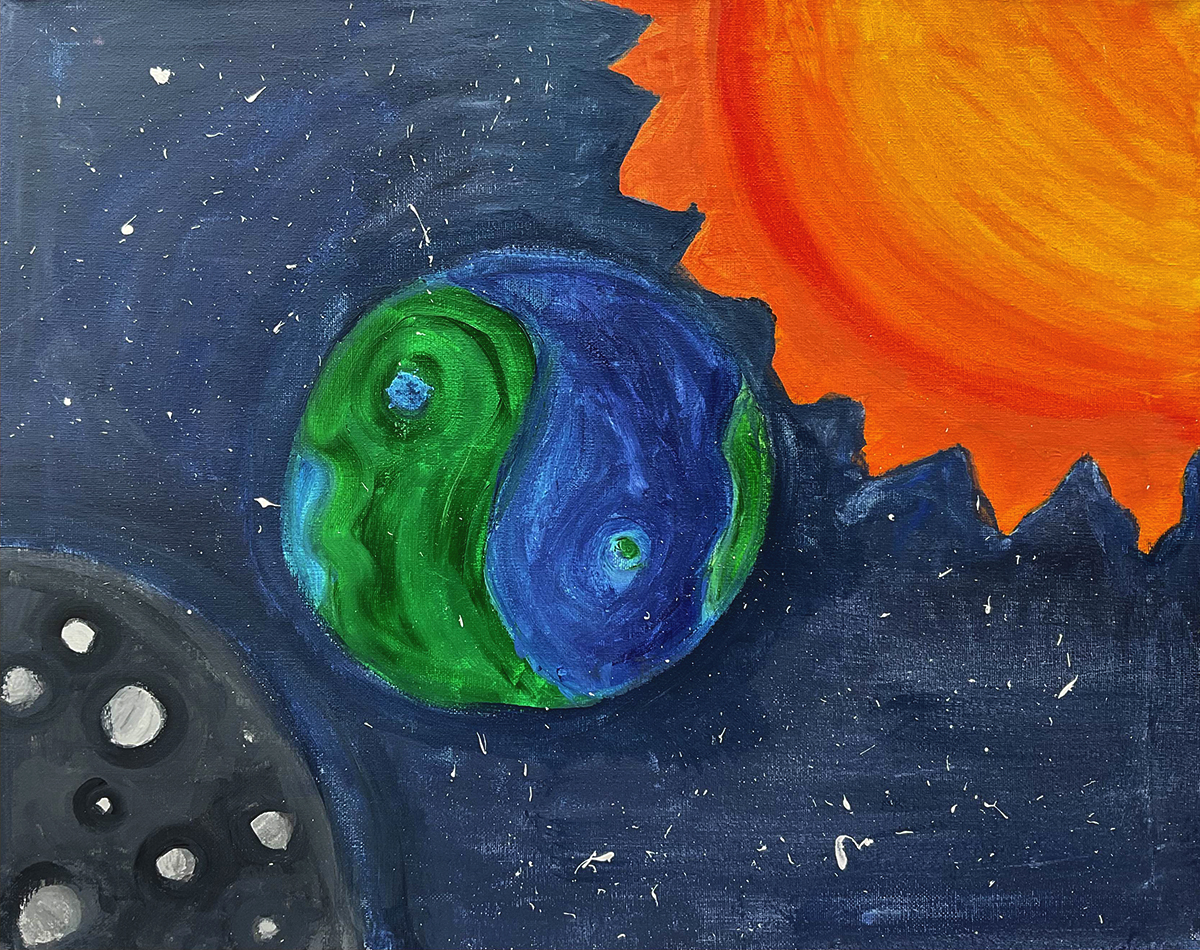
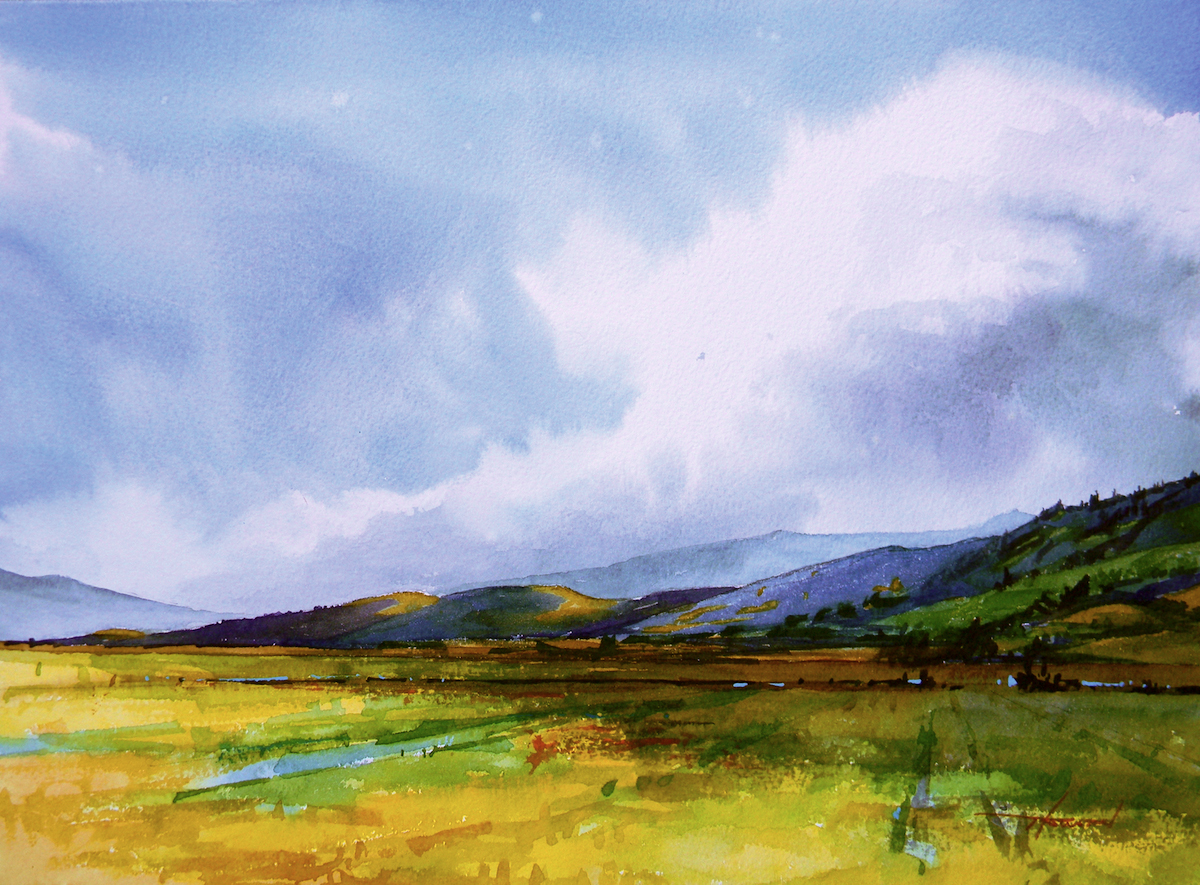
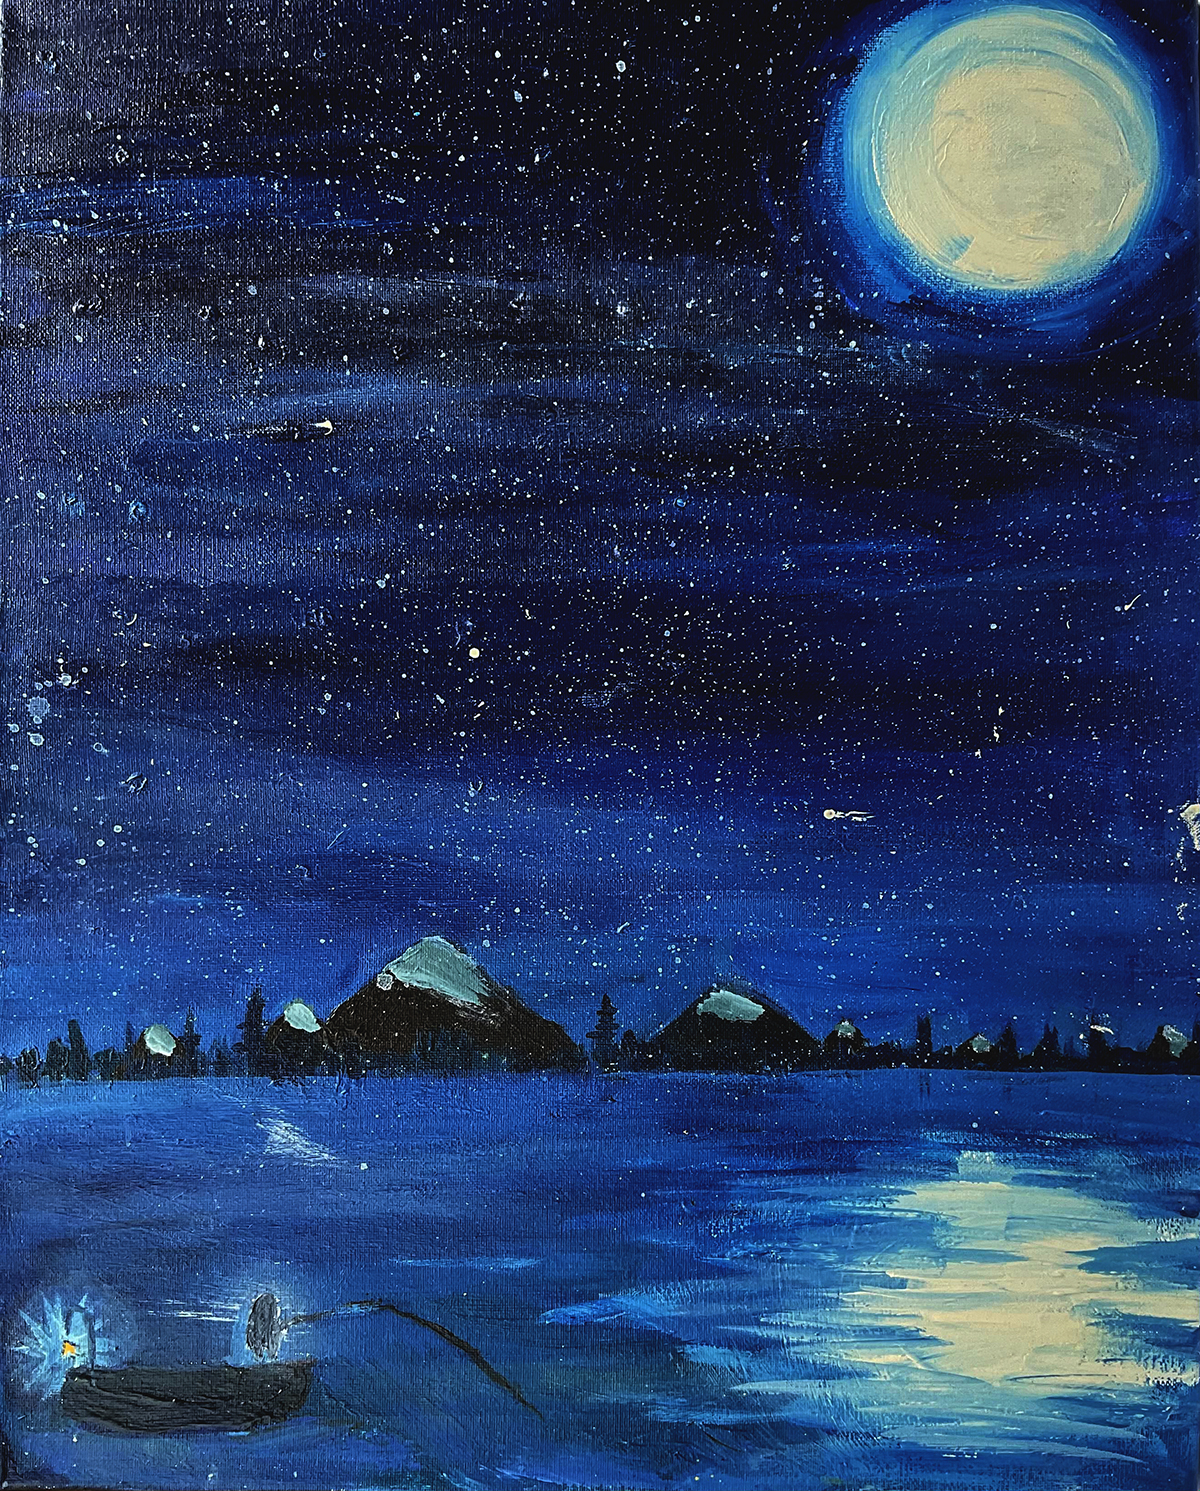
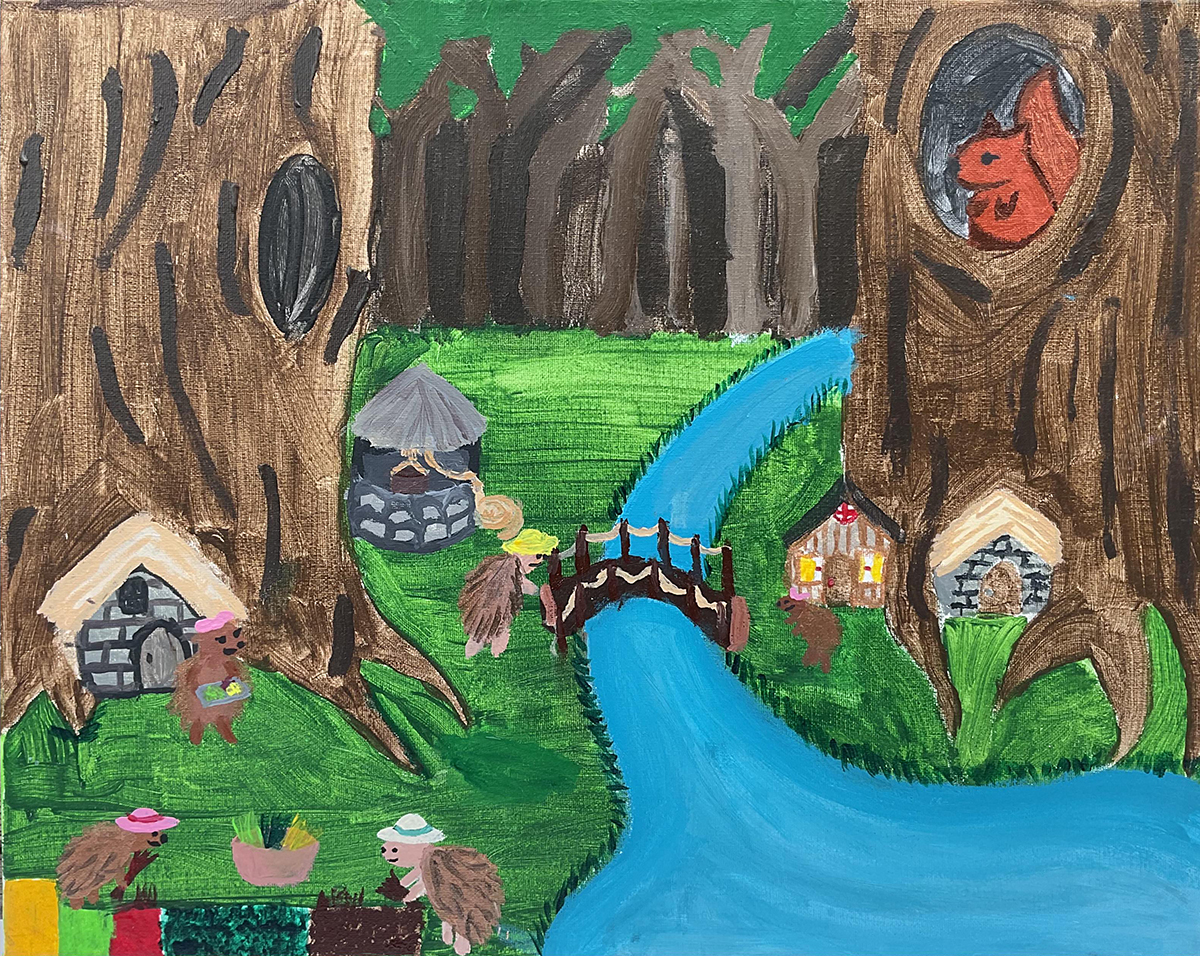
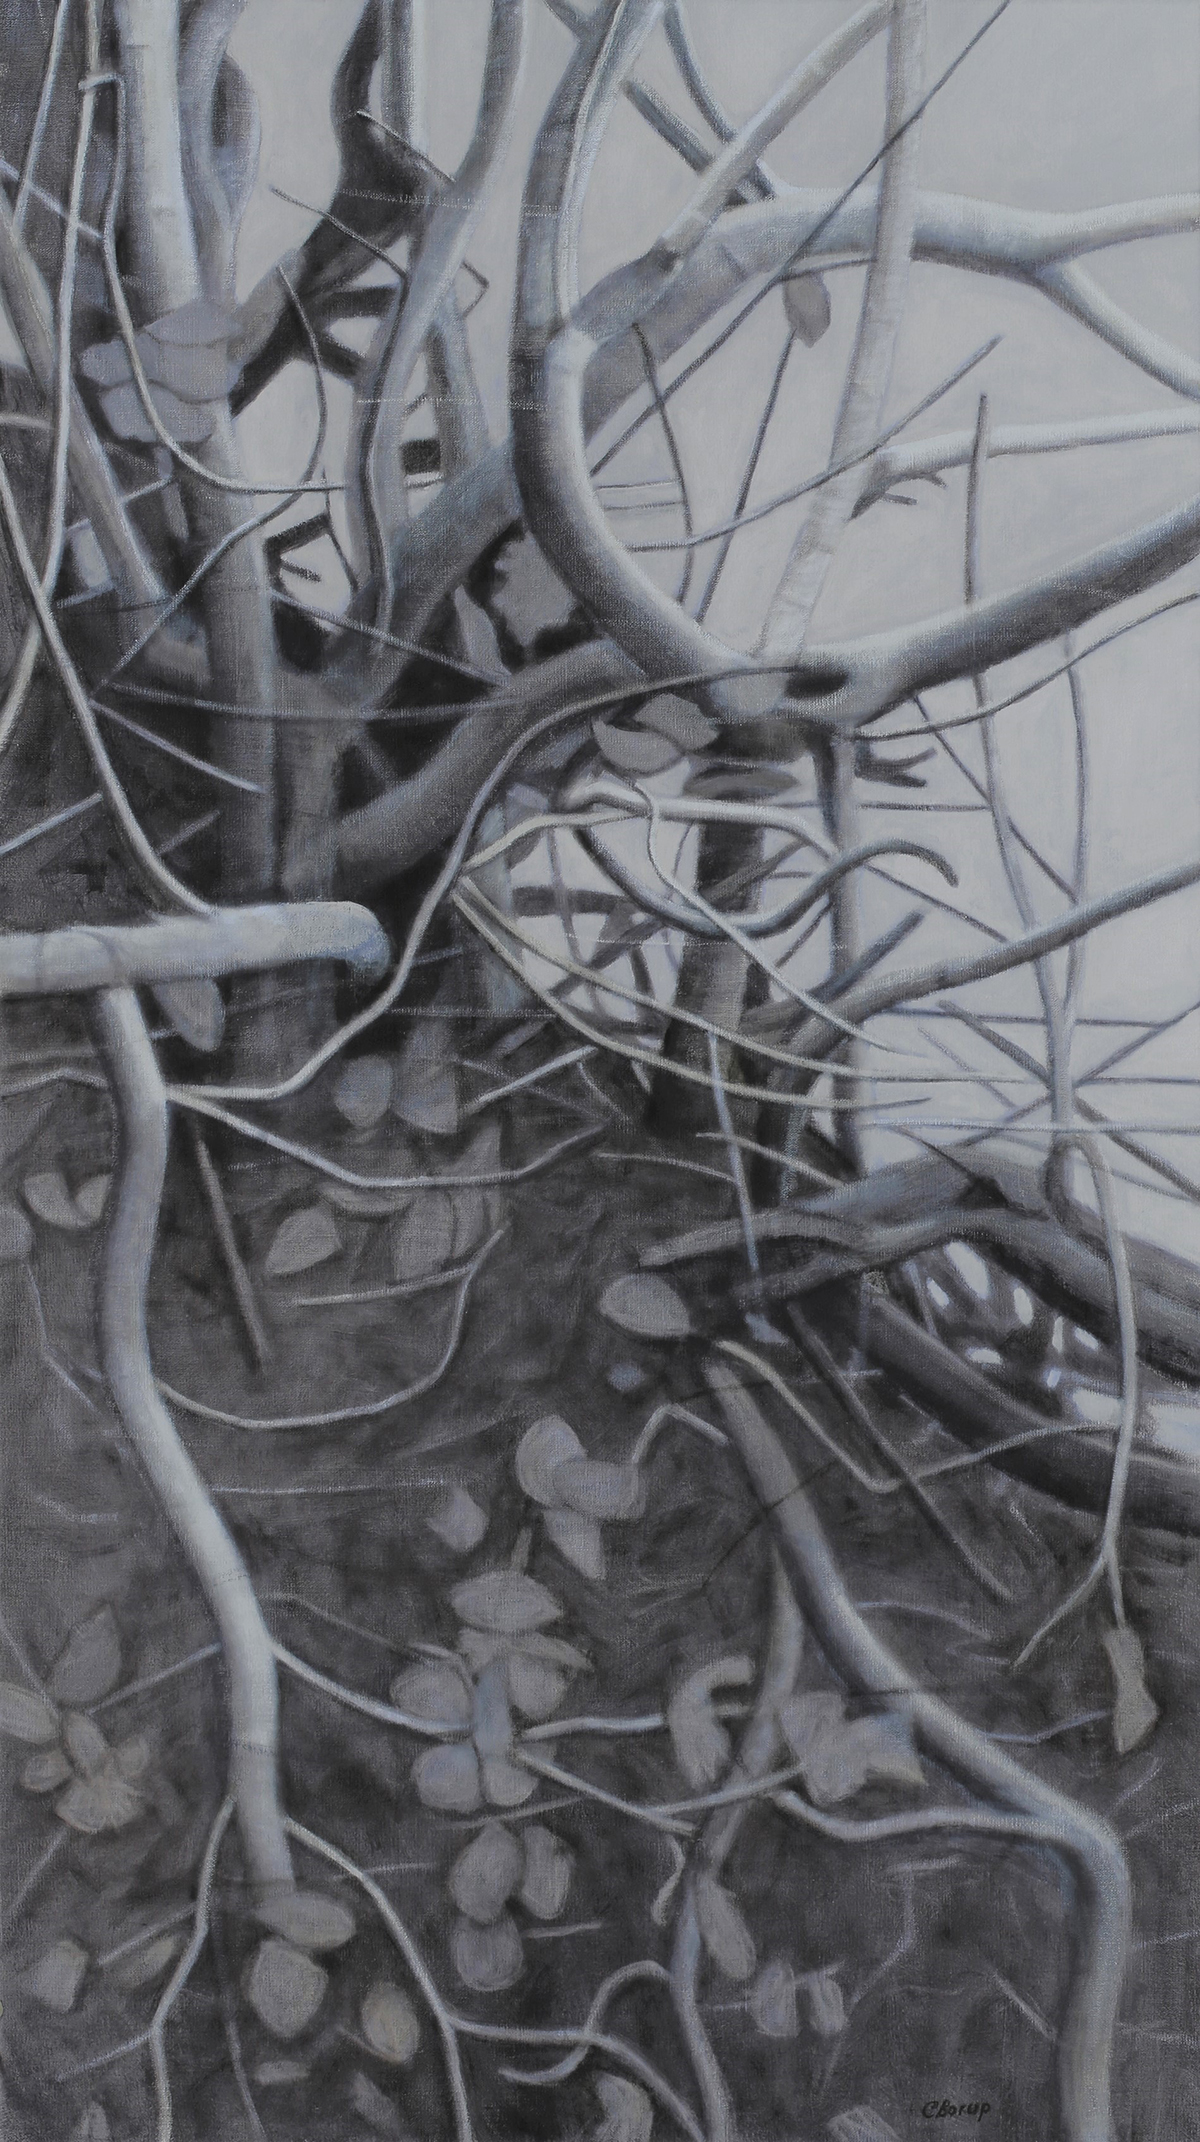
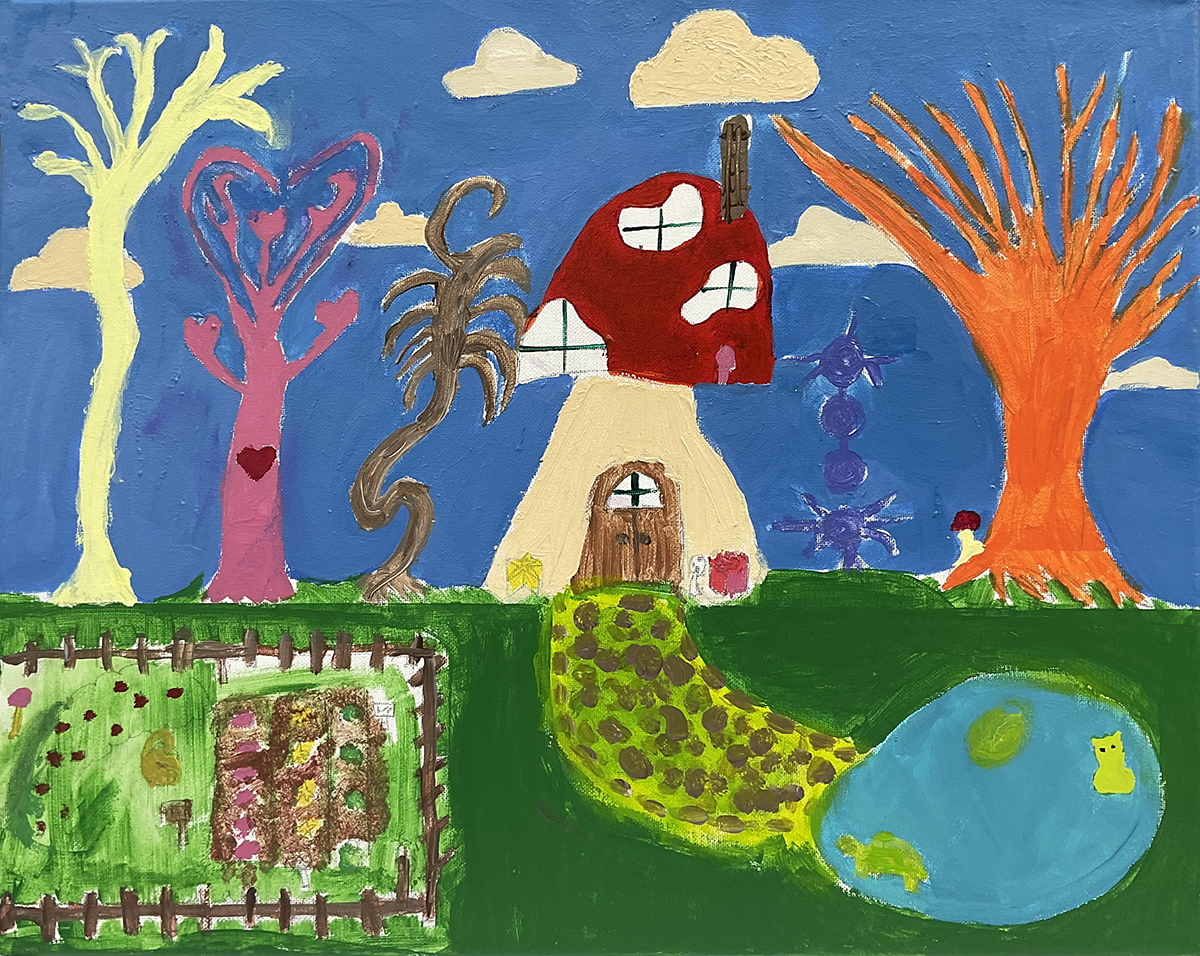
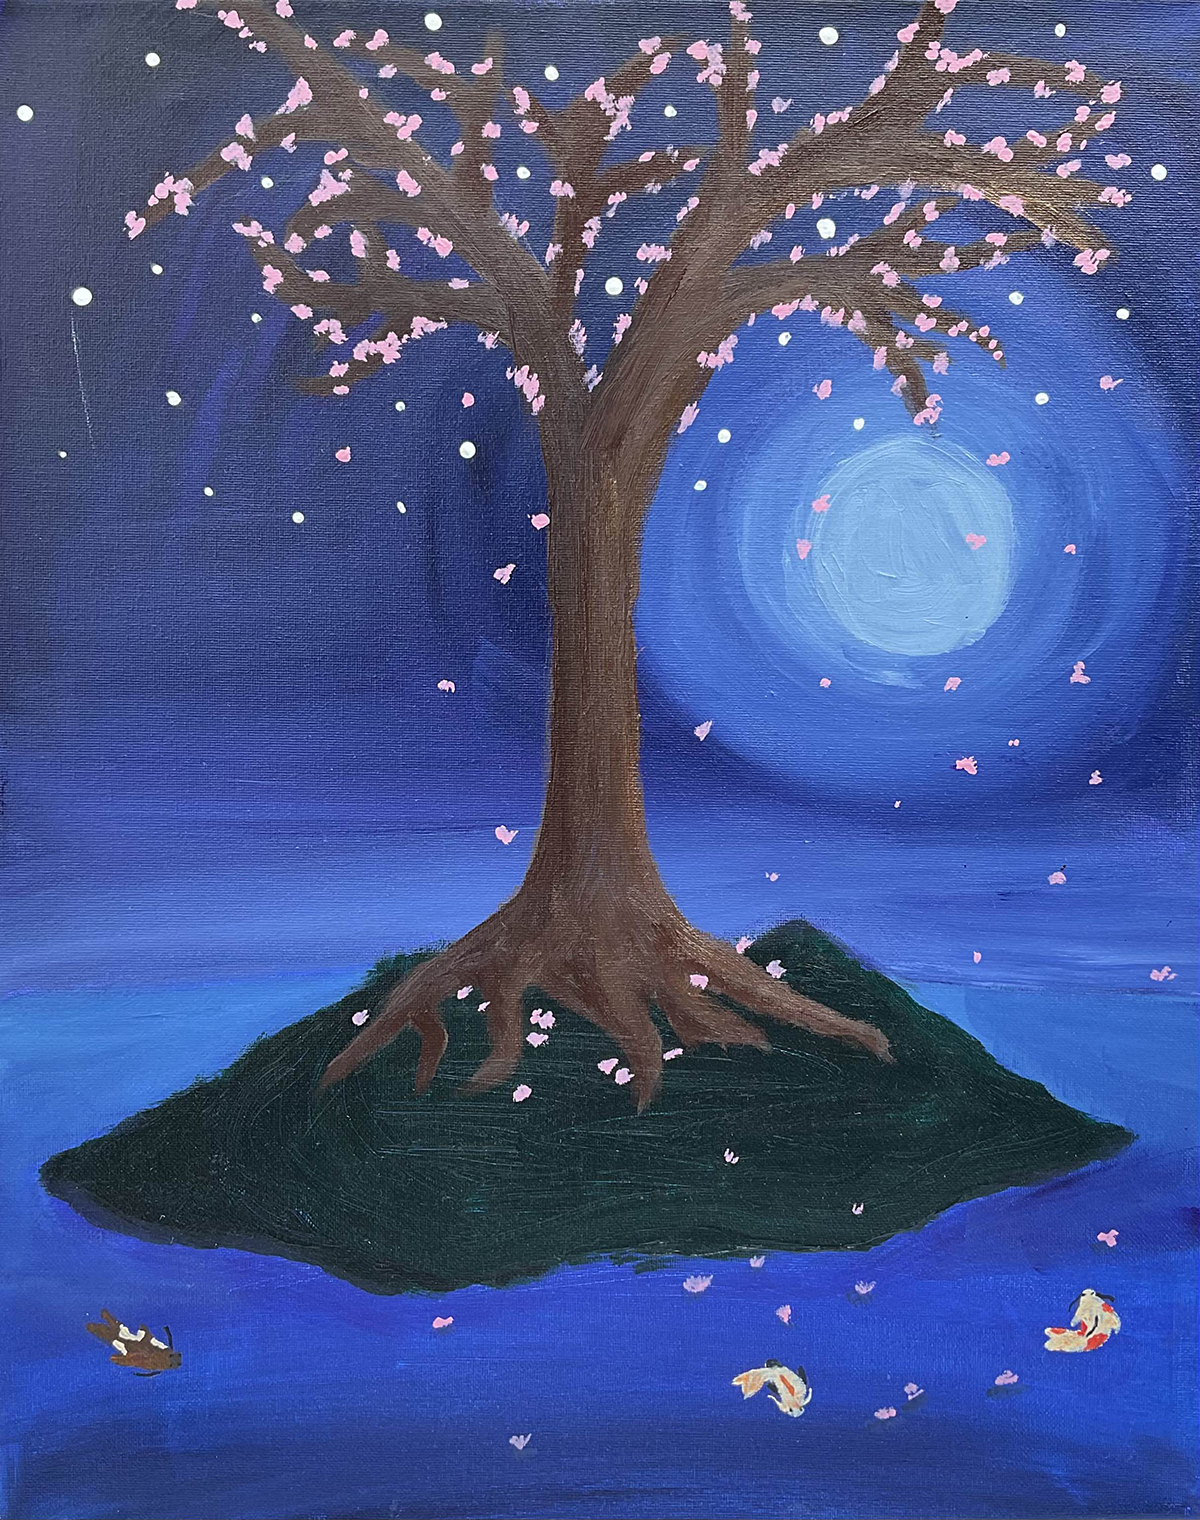
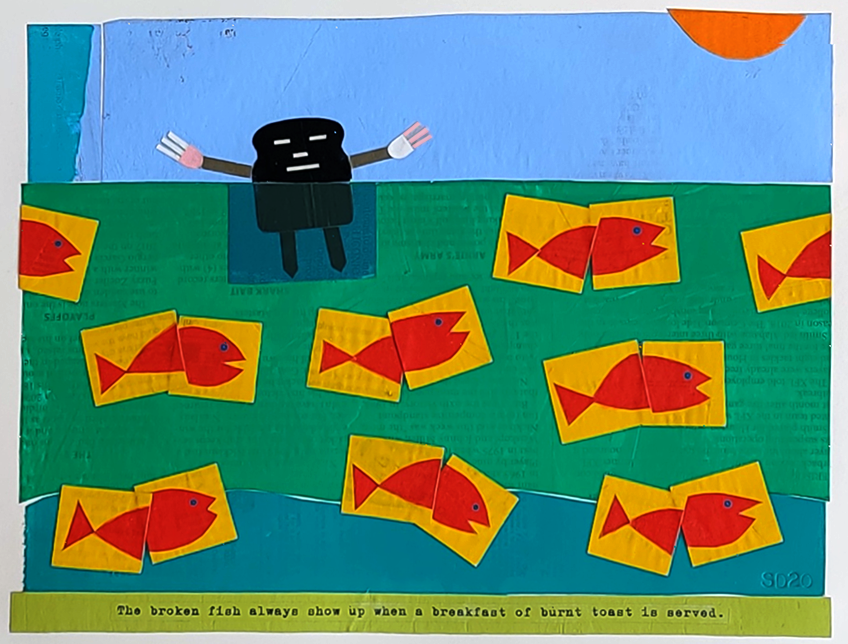
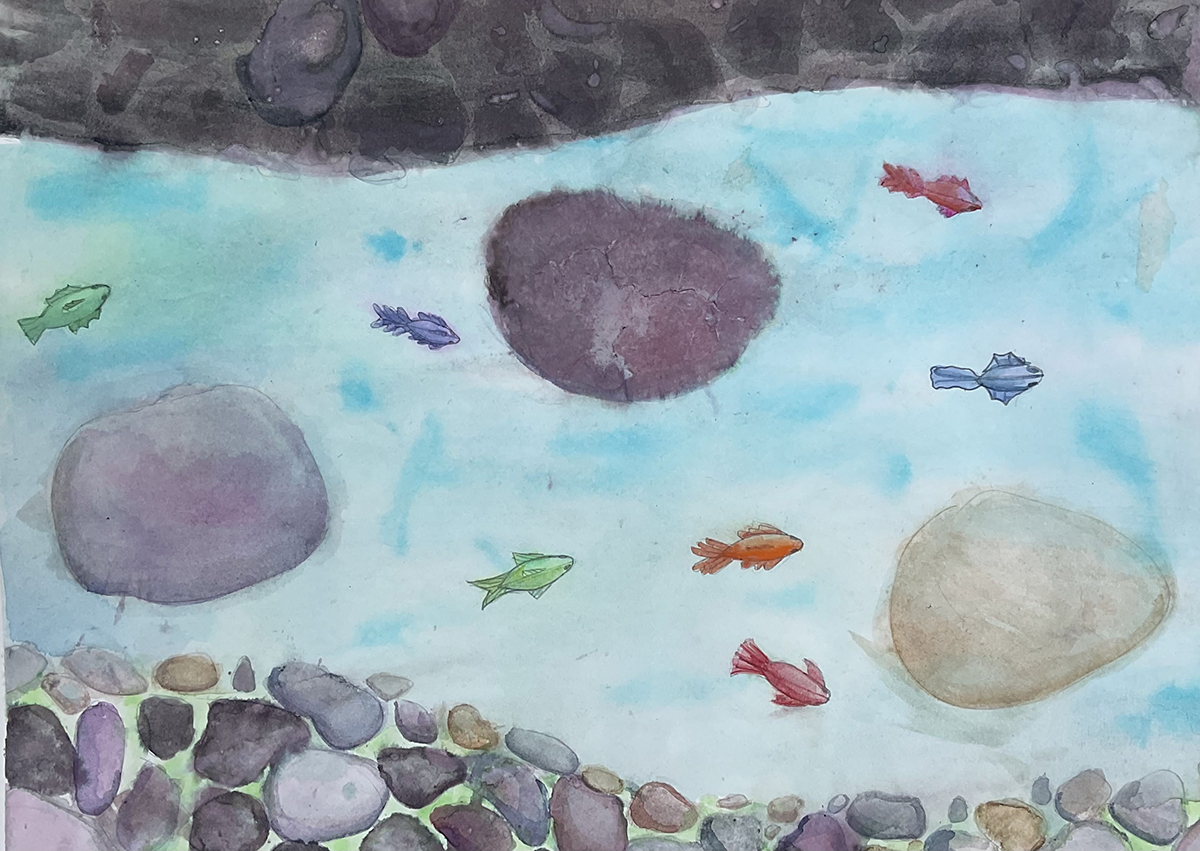
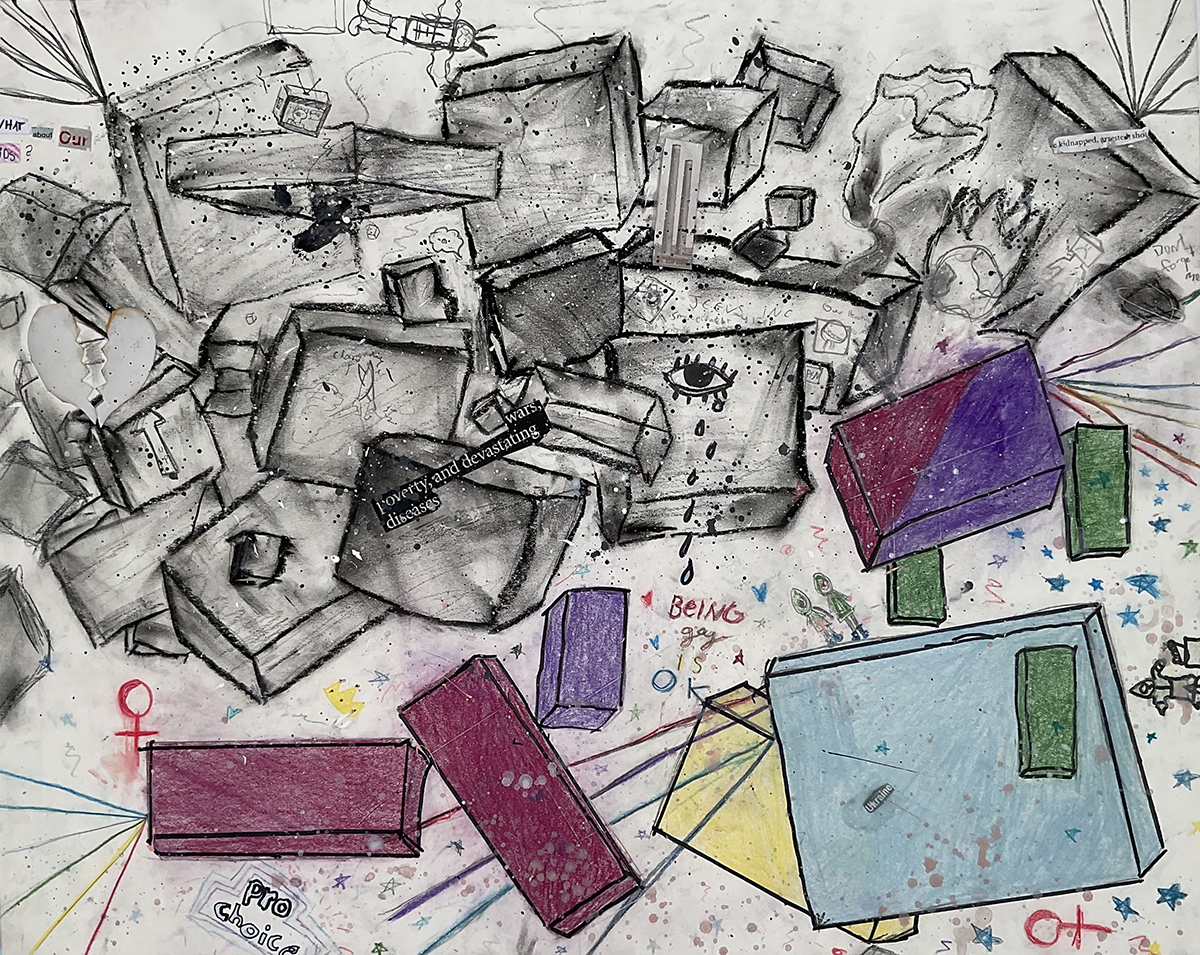
A Collaborative Exhibit with students from the McGillis School
STEP 1:
Sixth-grade students came up with a mathematically relevant statistical question based on each original artwork from the Phillips Gallery. They collected data based on that question and handed off the info to a separate group of kids.
STEP 2:
This second group of students never saw the original artwork, but instead, were only given the statistical question and the relevant data. They were then tasked to create an original piece of art that had to include the math they were given.
RESULT:
Now, side-by-side, the original art and the student art are examples of work that is derived from the same statistical data, but produces very different results. How often do we have the same data and come up with different interpretations?
Please inquire via email if you would like to see additional pieces by this artist.


444 E. 200 S. Salt Lake City, UT 84111 | 801-364-8284
.jpg)